The establishment of habitat goals for the San Francisco Bay Area is a big step forward for strategic biodiversity conservation. Those interested in applying the goals are encouraged to spend a little time reviewing the approach of the Conservation Lands Network (CLN) and how it is best translated to on-the-ground conservation. A few key guidelines are highlighted here while Chapter 11 of the final report provides a full discussion on this topic.
The Bay Area Open Space Council is committed to making the Conservation Lands Network accessible to all users regardless of their GIS skill level. The Conservation Lands Network Explorer allows users to draw the boundary of a property or area of interest, explore the natural resources that may be present, and evaluate how it fits within the Conservation Lands Network. Users can access numerous datasets compiled or developed by the Conservation Lands Network including vegetation types, rarity rankings, protected lands, streams, topography and the Conservation Lands Network. In addition to viewing the data, when users use the pencil tool to draw a custom area, a brief report displaying information from key datasets is instantly displayed under the Area Info box. Users can generate a more detailed Biodiversity Portfolio Report can be generated that provides additional information on the biodiversity value of a chosen area.
The best available data was used to complete the Conservation Lands Network, but it is inconsistent in some areas and at a coarse scale covering the 4.5 million acres of the Bay Area. Site visits and biological surveys are essential for parcels of all sizes when considering conservation actions, but are especially important when less than 100 acres. Users are encouraged to review How to Use the Conservation Lands Network and Chapter 11 of the full report.
The Conservation Lands Network is using the best available data for the region, but the data may be inconsistent and incomplete in some instances. The data allow the identification of areas that may be suitable for inclusion in the Conservation Lands Network at a regional level, but in most cases is less suitable for fine scale or parcel-specific planning. Site visits and biological surveys are essential.
Login error. Please check your Email address and password and try again.
As a registered user, you will be able to:
Generate PDF Biodiversity Portfolio Reports
Share a link to your map
Download shapefile of your custom area
Upload your shapefile
Thank you for registering with us. You may now log in using your email address and specified password. You will also receive an email confirmation of your registration.
Welcome to the Conservation Lands Network Explorer. Please use the following instructions to help you get started.
Dropdown Menus
This dropdown menu includes a list of layers that can be added to the map.
When a layer has been added to the map, the associated legend will appear on this dropdown.
Area Info can be displayed for a selected area of interest. To draw your area of interest, use the draw tool:
Base Map
The underlying base map can be changed by clicking on one of the five available base maps, with the current base map highlighted:
Additional instructions coming soon
Click to zoom in
Click to zoom to the Bay Area
Click to zoom out
Use the draw tool to draw an area of interest. While the tool is highlighted, single-click to draw a boundary around your area of interest. Double-click to finish the drawing. Once finished, the Area Info box will appear with information about the drawn area of interest. Click on "Detailed Area Report" for more information.
Use the pan tool to pan around the map. While the tool is highlighted, click and drag the map to move around.
Use the zoom tool to zoom to a specific area of the map. While the tool is highlighted, click and drag to draw a rectangle on the map. The map will zoom to the selected area.
Click on clear drawing to clear any previous drawings on the map.
Click on Upload Shapefile to generate a report using your custom shapefile.
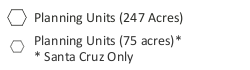
The Marxan software requires consistently-sized planning units covering the study area. Not to be confused with the larger irregular physiographic-based landscape units, the 100ha (247 acres) hexagonal planning units were overlaid on the entire study area. Marxan ties all input data and results to these hexagons. While it is possible to run Marxan with parcel data, the project team deliberately used hexagonal planning units to preclude Marxan from targeting specific parcels.
To ensure that conservation targets are conserved across latitudinal, elevational, and other gradients (building in redundancy), the nine-county San Francisco Bay Region was divided into thirty four landscape units. Conservation goals were set for the coarse and fine filter targets in each of the landscape units. In some cases, different goals were set for the same species in different landscape units reflecting its relative abundance or rarity. This geographic stratification captures much of the ecological variability found within species. More info >>
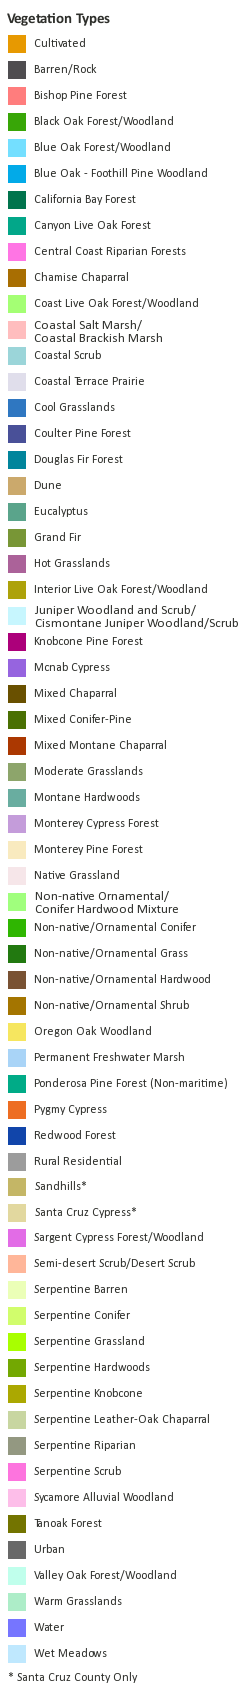
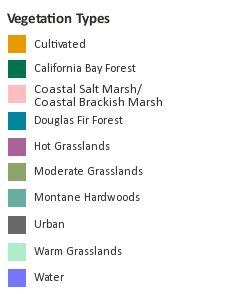
The Coarse Filter Vegetation Dataset is a 30-meter grid GIS dataset and currently has 61 cover types, 51 of which are natural or semi-natural land cover types. This dataset was created specifically for the Conservation Lands Network project and was used to identify coarse filter (vegetation type) conservation targets and set goals. The dataset is primarily from CalVeg, but some other sources were used in addition to some modifications. More info >>
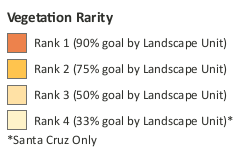
Vegetation Rarity Rankings were assigned to the coarse filter conservation targets (vegetation types by landscape unit) by the Vegetation Focus Team to determine appropriate protection levels. Rank 1 vegetation type conservation targets are globally unique or the highest priority locally rare vegetation types. Rank 2 are locally rare vegetation types comprising 5% or less of a landscape unit. Rank 3 vegetation type conservation targets are locally and globally common vegetation types, also referred to as matrix species, comprising more than 5% of a landscape unit. Rank 4 lands are Converted Lands that include Urban, Cultivated Agriculture or Rural Residential (collectively called Converted Lands) that do not contribute to biodiversity.More info >>
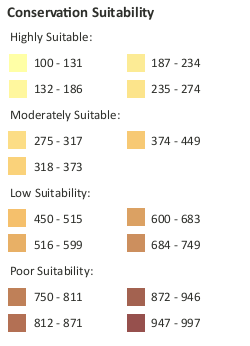
Parcelization, population density and distance to paved roads were chosen to estimate conservation suitability because all three contribute to habitat degradation and fragmentation. Larger, intact regions are considered to be of higher ecological integrity. These three factors were combined to create the total suitability index. The brown areas are of low suitability (urban, close to roads, high population density) and the light tan areas are more suitable (larger parcels, further distance to roads, lower population density). More info >>
The Conservation Lands Network (CLN) is the recommended configuration of interconnected habitats for preserving biodiversity in the Bay Area. Many factors were considered in the development of the CLN including the conservation targets (coarse and fine filter), goals for those targets, land use, proximity to existing protected lands, conservation suitability (ecological integrity) of the landscape, in addition to the expert opinion of focus team scientists. More info >>
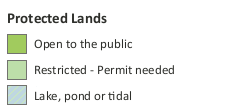
An important step in the conservation planning process is identifying existing protected lands and evaluating the contribution of those lands to biodiversity values based on the level of stewardship provided by the managing entity.. This GIS dataset, known as the Bay Area Protected Areas Database (BPAD) is maintained and updated annually by the Open Space Council and GreenInfo Network. BPAD includes open space that is owned in fee or easement by a public agency or a private, nonprofit land trust and is held primarily for open space purposes. More info >>
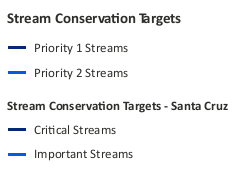
Streams play an integral role in maintaining biodiversity of the Bay Area and for this reason, the Riparian/Fish Focus Team chose all Bay Area streams as conservation targets. They also chose to divide the streams into priority categories to indicate relative importance.
Priority 1 streams and watersheds have existing steelhead populations, available rearing habitat and historic or current coho populations that must be conserved and/or restored as soon as possible for fish conservation to be effective.
Priority 2 streams and watersheds should receive substantial protection and restoration for long-term fish conservation. Priority 2 streams have smaller steelhead, land-locked rainbow trout populations and other/or healthy assemblages of native fish. They may also be isolated stream segments with high conservation value.
Priority 3 streams are all remaining streams. For cartographic purposes these streams are only displayed when zoomed in.
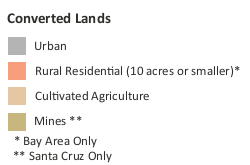
A regional conservation plan must identify lands that have been converted to land uses that have degraded or eliminated native vegetation cover and therefore provide less opportunity for biodiversity conservation. Urban, Rural Residential and Cultivated Agriculture are the Converted Lands that are mapped out and are illustrated below.
Conservation goals were not set for these three land use classes to force Marxan, the site selection software, to focus on more intact. Nonetheless, the high conservation goals set for the CLN resulted in the inclusion of Converted Lands to meet coarse and fine filter goals. See here for more information. More info >>
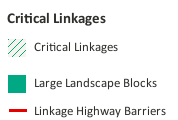
Critical Linkages - The final focal species-based Critical Linkage designs, connecting the 15 Large Landscape Blocks. More info >>
Large Landscape Blocks - These are areas of high ecological integrity that build upon the existing protected areas and serve as the end points for the 14 Critical Linkages. More info >>
Highway Barriers - These are ares where major highways intersect the Critical Linkages designs. More info >>
The landscape units that are intersected by the custom area selected with the pencil tool are listed under Area Info. If the area drawn falls within one landscape unit, then only one landscape will be listed, but if the area drawn intersects two or more landscape units then all will be listed. More info >>
Distance to paved roads, parcelization and population density were used to develop the Suitability layer. The three factors were combined and a final value, from 100-1000, was attributed to the corresponding 100 hectare hexagons. The lower the number the more suitable for conservation. More info >>
The Explorer pencil tool performs a weighted average of the total custom area chosen by the user therefore factoring in the partial hexagons chosen in the custom area.
These are the final reporting categories:
100-274 Highly Suitable for Conservation 275-449 - Moderately Suitable for Conservation 450-749 - Low Suitability for Conservation 750- 1000 - Poor Suitability for Conservation
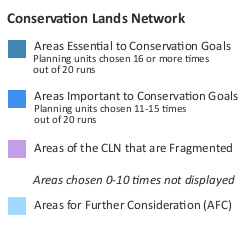
The Conservation Lands Network (CLN) is the recommended network of the Conservation Lands Network project for preserving biodiversity in the Bay Area. More info >>
The Explorer pencil tool performs a weighted average of the total custom area chosen by the user therefore factoring in the partial hexagons chosen in the custom area. It then displays the the CLN categories based on the majority of the custom area:
Areas Essential to Conservation Goals Planning units chosen 16 or more times out of 20 runs
Areas Important to Conservation Goals Planning units chosen 11-15 times out of 20 runs
If the majority is outside these two categories then it displays "Not included in the Conservation Lands Network"
It will also display the acreage of the CLN in fragmented areas if 25% or more of a hexagon of the CLN overlaps with Urban, Cultivated or Rural Residential classes.
The Conservation Lands Network generated by Marxan largely captured a coherent and representative network across the landscape units. However, there were a number of areas where the Conservation Lands Network did not capture important biodiversity targets, develop a viable local configuration, or provide local (within landscape unit) connectivity. In these cases, planning units (247-acre hexagons) were identified as "Areas for Further Consideration."
PET: Potential Evapotranspiration (mm H2O per month or per year)
PET is the amount of water that could be evaporated if it were freely available (or, provided an unlimited supply of water).
Increased PET means higher evaporative demand.
Decreased PET means less evaporative demand.
AET: Actual Evapotranspiration (mm H2O per month or per year)
AET is the amount of water transferred from the soil to the atmosphere through vegetation and direct surface evaporation.
Decreased AET means less vegetation productivity.
Increased AET means more vegetation productivity.
CWD: Climatic Water Deficit (mm H2O per year)
CWD is an integrated measure of seasonal water stress and aridity. It is the additional amount of water that could have been evaporated had it been freely available. It is calculated as a cumulative sum over the dry season.
Increased CWD means higher water stress for vegetation, and greater risk of fire. Greatly increased CWD (50-100+ mm/year over 30 years) can lead to death of existing vegetation through drought stress.
Decreased CWD means less water stress and potentially lower fire risk.
DJF Tmin: Average Winter (December through February) daily minimum temperature °C
The average minimum temperature over the coldest months (December-February) is a prime determinant of frost and freeze frequency, and chilling hours for winter dormant plants.
JJA Tmax : Average Summer (June-August) daily maximum temperature °C
The average summer maximum temperature in the three warmest months (June-August) is a prime determinant of heat wave extremes, and is an important contributor to PET and aridity.
PPT: Precipitation (mm H2O per month or per year)
PPT is the total annual precipitation in mm (25.4 mm = 1”)
Increased PPT directly increases runoff, may increase recharge if distributed through the rainy season, and can ameliorate aridity if it falls in March-May (higher AET and lower CWD).
Decreased PPT directly decreases runoff and recharge, and increases aridity (lower AET and higher CWD)
Recharge: Recharge (mm H2O per month or per year)
Recharge is water that drains below the rooting zone and becomes groundwater for more than a month. Recharge is affected greatly by bedrock permeability and soil depth. Because recharge provides natural subsurface storage that provides the sole source of stream baseflow in the dry season, and many Bay Area communities depend on well water, it is a precious resource. Conservation of high recharge areas is a high priority.
Increases in recharge result in greater groundwater aquifer storageand maintenance of baseflow (stream flows during periods absent precipitation) during multi-year droughts.
Decreases in recharge results in less groundwater storage and loss of baseflow, especially during multi-year droughts.
Runoff: Runoff (mm H2O per month or per year)
Runoff is the water that feeds surface water stream flow, and generally occurs during storms when the soil is fully charged with water. Runoff occurs on shallower soils more rapidly than on deeper soils.
Baseline (1951-1980)
Recent (1981-2010)
Near Century (2010-2039)
Mid Century (2040-2069)
End Century (2070-2099)
Baseline & Recent These are not predictive models, but records since 1951.
Drier - High emissions (GFDL-A2)
Drier - Low emissions (GFDL-B1)
Wetter - High emissions (PCM-A2)
Wetter - Low emissions (PCM-B1)
File uploads can take a while,
depending on the size and nature of the data,
and on your upload speeds and other traffic on the network.
You can upload an ESRI Shapefile of your area. You must first compress the Shapefile into one .zip file, and be sure to include the projection in a .prj file.
Browse your computer to select your .zip file, then click "Upload".
You can upload a KML or KMZ file of your area.
Browse your computer to select your .kml or .kmz file, then click "Upload".
Please login to activate the shapefile upload/download tool.
Copy and paste this link into email or documents to share your map.
Generating report...
The download link will appear momentarily.
The area submitted is not a valid polygon (there may be overlapping areas, etc).
We have run an automated process to fix the polygon. In some cases, the process is unable to create a polygon that closely matches the intended area. Please review the revised polygon on the map to determine accuracy of the corrections. If necessary, please redraw your area.